InspectionBrowser
Currently, public health data on prisons and jails exists in hundreds of word documents and PDFs. Researchers looking for public health data on Massachusetts must hand tabulate these data for analysis. InspectionBrowser is a tool that downloads, parses, aggregates and analyzes all available data on facilities of incarceration in the state. The aim of the project is to make prisons and jails a little more transparent.

The image on the left is a simple linear regression in ggplot2 looking at available data on prison census over time, with code violations as a linear outcome. Preliminary analyses suggest that there is a strong correlation between prison overcrowding and crumbling infrastructure.
State inspection data is posted on https://t.co/w0rnHsNQXy in long form in nearly unreadable docx and pdfs. https://t.co/i9dCxkVbtd is a combination of Python and R that downloads and converts these documents, generating frequency tables tabulated by regulation #. pic.twitter.com/BqhZQs3LHf
— jess kant (@jessdkant) July 27, 2020


mapIt/crimeviz
This project, hosted on GitHub examines policing in Boston using the datasets available through Analyze Boston, the City of Boston’s online data portal. This project allows users to generate instant visual representations of reported police incidents, and provides ready-to-use templates for sorting, merging and analyzing BPD data.
The repository also contains plots generated from the BPD’s Field Interrogation and Observation (FIO) dataset, which logs all encounters between civilians and the police. The plot on the left shows the disproportionate rate of assumption of “probable" cause” broken down by race and gender.
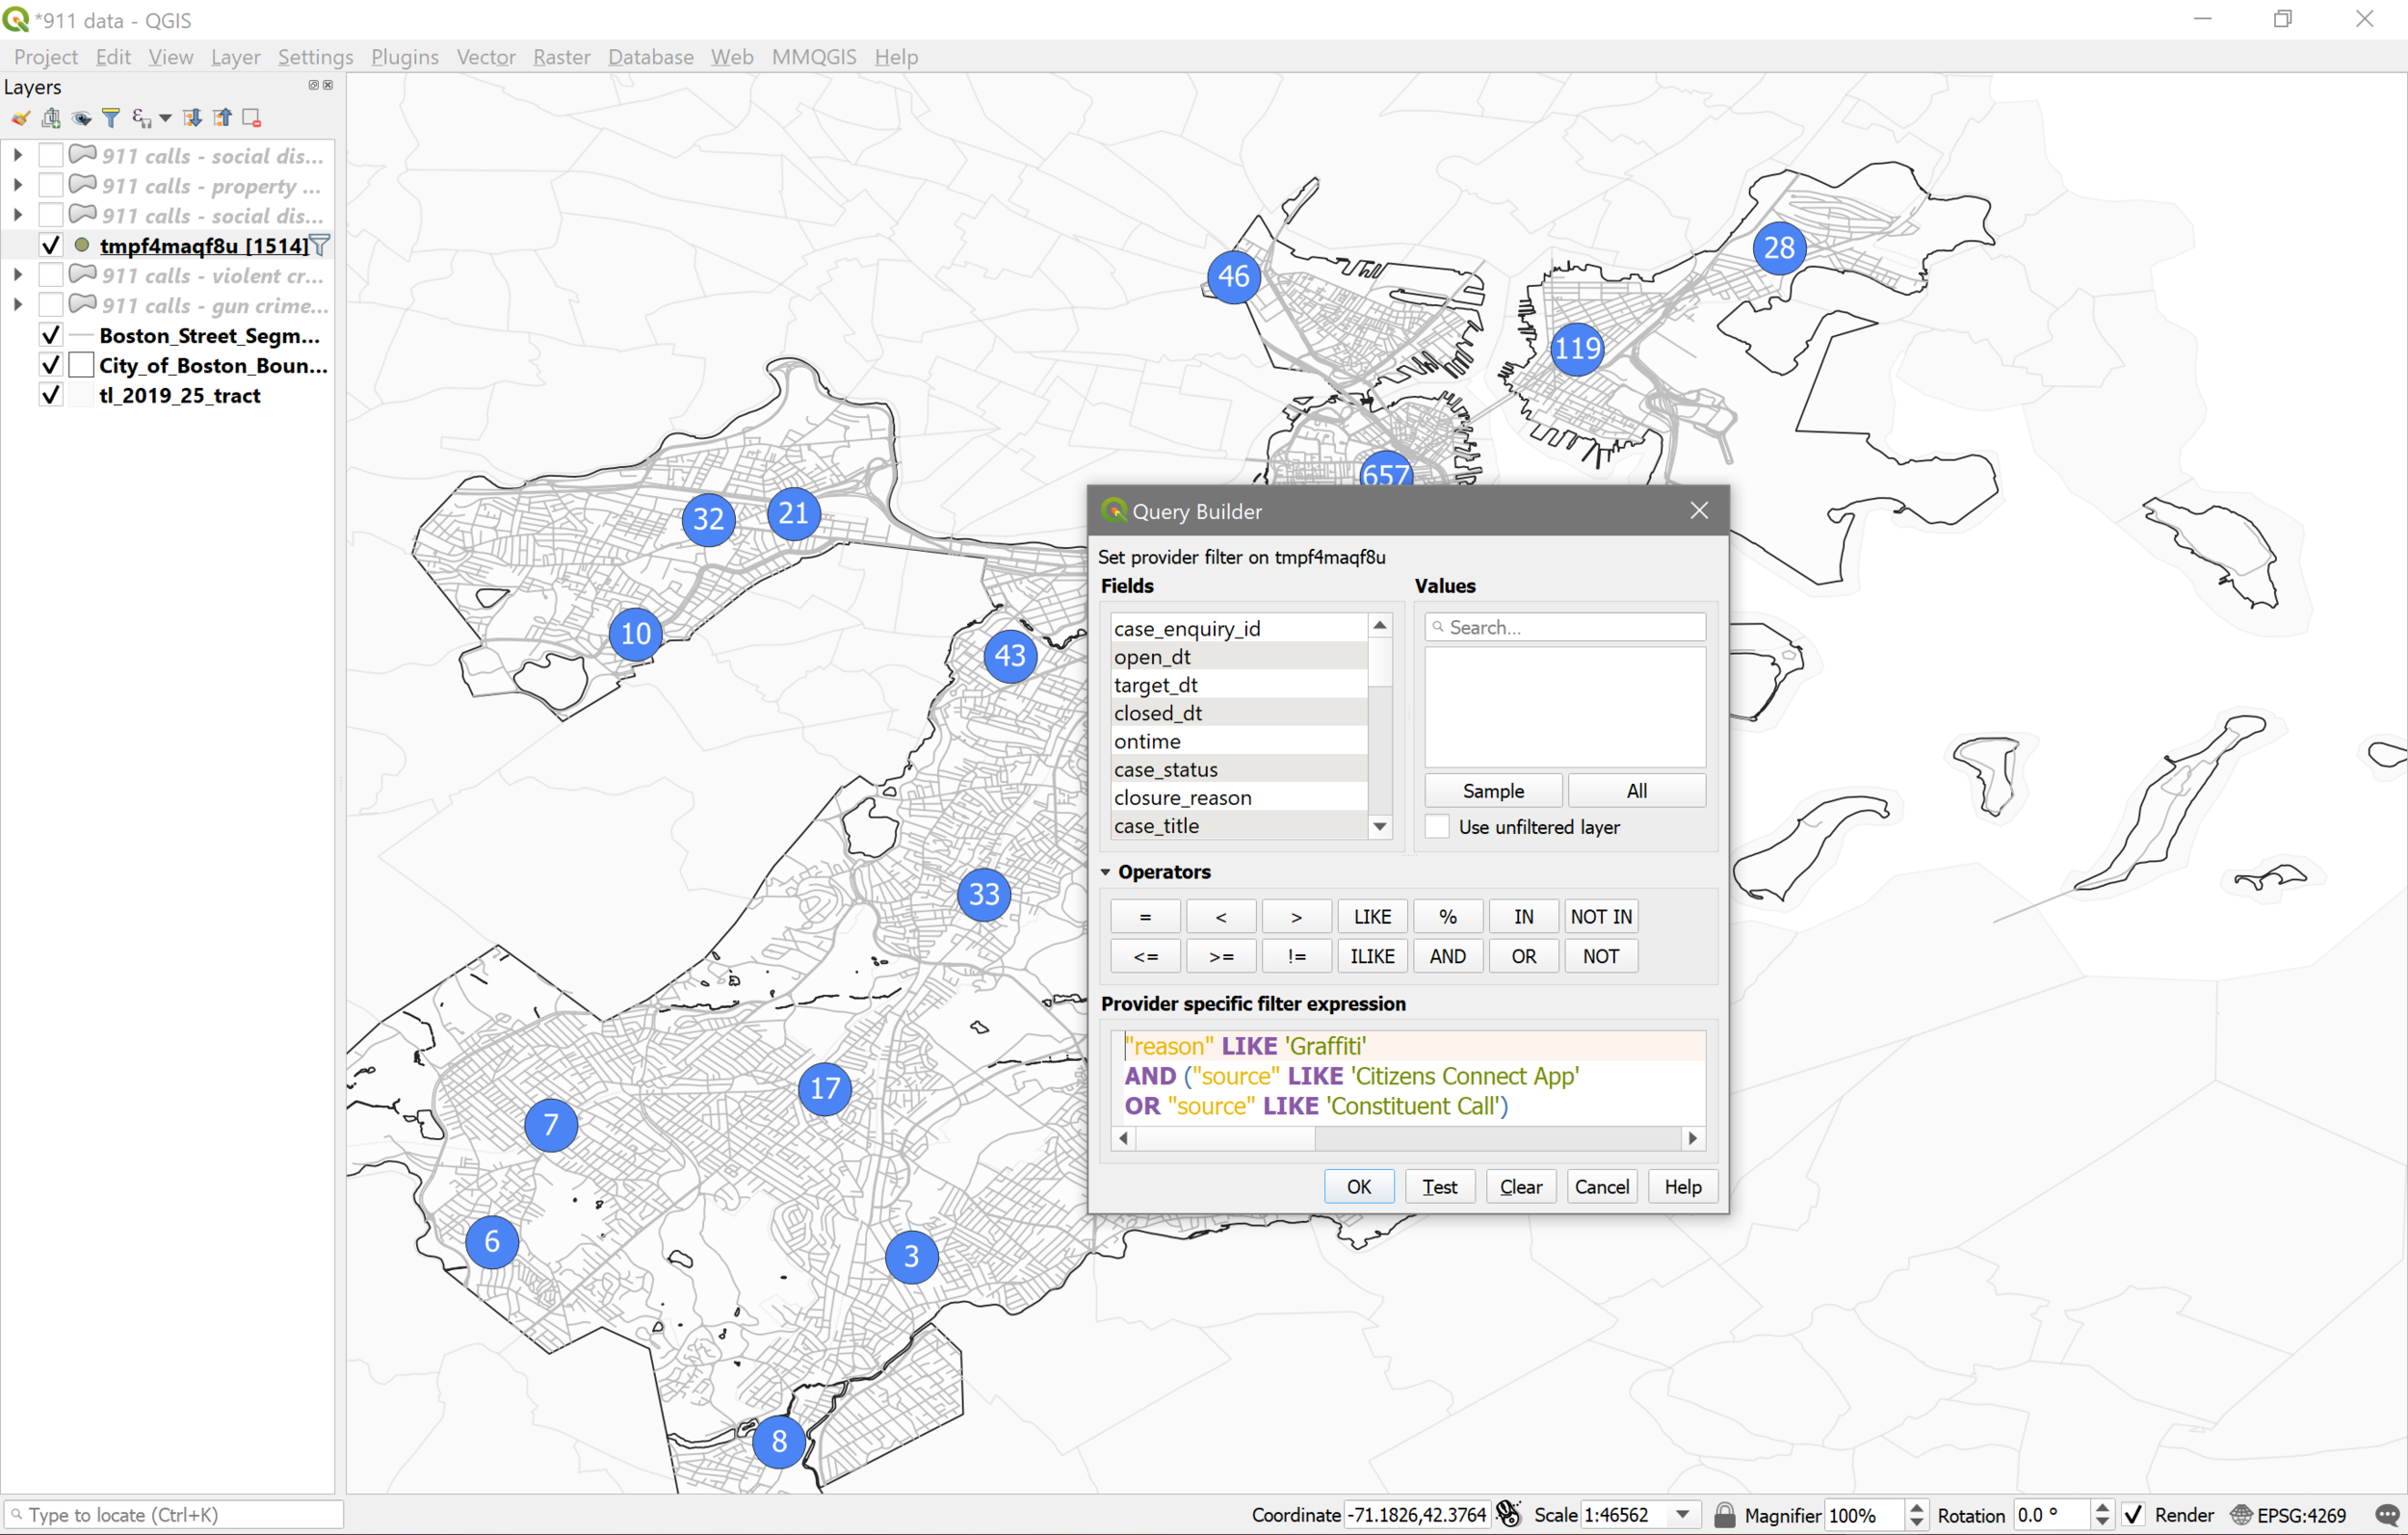
Shapefiles are also available here, generated from Boston’s crime, fire and 311 data and can be imported into both ArcGIS and QGIS.